Quickstart
poskiorb is a module that computes changes in the orbital parameters of a binary system after
a core-collapse event with an associated asymmetric kick imparted to the compact remnant.
Equations to compute these changes are derived from the conservation of linear momentum as presented in Kalogera, 1996.
Installation
We provide a single Makefile that will allow you to install the code. In order to do that,
grab the latest version of the code from the RELEASE PAGE
Once downloaded, unzip it and, in a terminal, run
make install
Getting started
Here we provide a simple example on the usage of the poskiorb module.
To start using the module, you can import it into an interactive python shell, a script or a jupyter notebook
import poskiorb
We’ll compute orbital changes to a binary system consisting of a collapsing star of 12.81 solar masses which produces an 8 solar mass black hole; its companion is a 7 solar mass star and the orbital period is set to 5 days (before the core collapse):
binary = poskiorb.binary.BinarySystem(
  m1=12.81, m1_core_mass=9, m1_remnant_mass=8, m1_fallback_fraction=0.50,
  m2=7,
  P=5
)
Next, we set the distribution of asymmetric natal-kicks. It will consist of 50000 kicks, with a
Maxwellian distribution in strength, isotropically-orientated, with a scaling to the strength based
on the amount of material that falls back to the compact remnant (m1_fallback_fraction):
binary.set_natal_kick_distribution(
  n_trials=50000,
  distribution_id='Maxwell',
  kick_scaling=lambda x: (1-binary.m1_fallback_fraction)*x
)

binary.get_natal_kick_distribution()
After having computed all the kicks, calculate post-kick orbital configurations (only those which remain bound):
binary.get_orbital_distribution(verbose=True)
Once the orbital parameters are known, divide the parameter space of separation (or orbital period) and eccentricity according to the probability of finding binaries in different 2D bins:
binary.get_post_kick_grid(use_unbounded_for_norm=True, verbose=True)
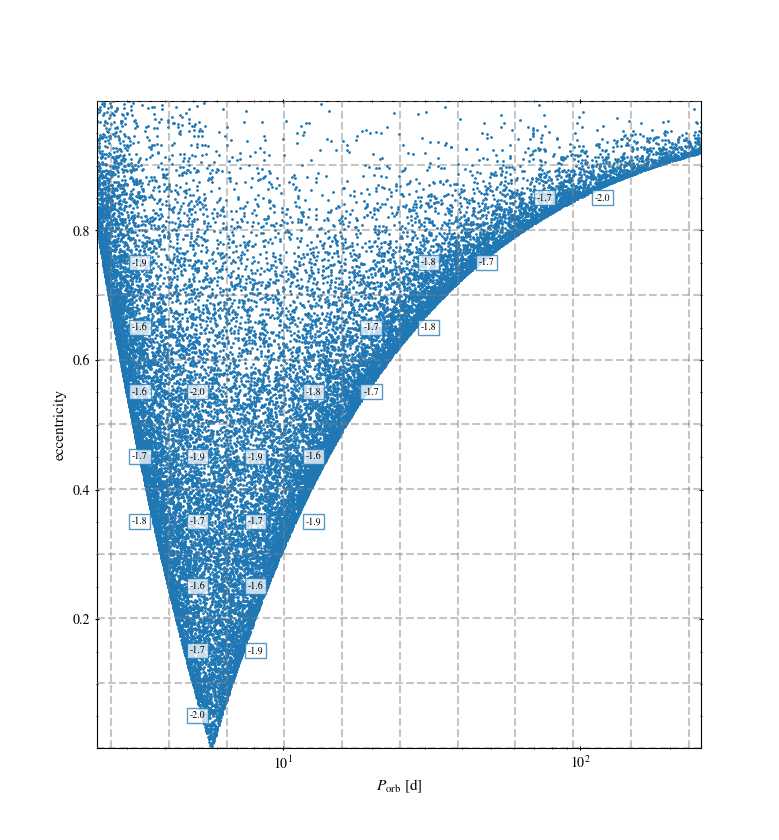
We can show this grid in a figure!
binary.show_post_kick_with_grid(xattr='P', yattr='e', s=1)
And even save this grid to a file
binary.save_target_grid(fname='grid.data')
Note
The output of this grid file will contain a header with information on the binary system and the distribution of kicks. Also, for each point in the grid, the probability of finding a binary there will be saved. It will look something like this:
# Target grid of orbital parameters
# Binary at core-collapse
#          m1 [Msun]          m2 [Msun]           P [days]           a [Rsun]     m1_core [Msun]              m1_fb  m1_remnant [Msun]
#       1.281000E+01       7.000000E+00       5.000000E+00       3.328600E+01       9.000000E+00       5.000000E-01       8.000000E+00
# Asymmetric natal kick parameters
#       distribution              sigma              min_w              max_w           N_trials           min_prob
#            Maxwell       2.650000E+02       0.000000E+00       1.000000E+99              50000       1.000000E-02

   natal kick id      period [days]  separation [Rsun]       eccentricity        probability
              00       5.120560E+00       3.082446E+01       5.169521E-02       1.048000E-02
              01       5.120560E+00       3.082446E+01       1.515052E-01       2.060000E-02